Presidential election Results 2012
") The final, final results from the 2012 presidential election are now in. While we already knew President Obama won (and the House certified that result today when it tallied the electoral votes), it's worth revisiting the final totals and reminding ourselves of one important fact: It wasn't particularly close.
The final, final results from the 2012 presidential election are now in. While we already knew President Obama won (and the House certified that result today when it tallied the electoral votes), it's worth revisiting the final totals and reminding ourselves of one important fact: It wasn't particularly close.
Sure the election was widely expected to be a nail-biter, but it wasn't. But in the days and weeks afterward you still heard the occasional GOPer insist that it was—see Texas Rep. Jeb Hensarling last month saying it was a tight, 51-49 race, for example.
- Obama got 51.1 percent of the popular vote to Mitt Romney's 47.2 percent, a four point margin. (Let's all pause for a moment and savor the fact that history will show that Romney won … 47 percent.) That's a wider margin than George W. Bush won by in 2004 (51-48), when pundits on the right like Charles Krauthammer declared that he had earned a mandate.
- That makes Obama the first president to crack 51 percent two elections in a row since Dwight Eisenhower more than a half-century ago. (Sorry, conservatives, Ronald Reagan only reached 50.75 percent in 1980.)
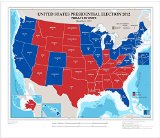
- Obama won 26 states and the District of Columbia, piling up 332 electoral votes. You can think of it another way: There is no state in Obama's column which would have swung the election to Romney had he won it. In other words, if Romney had pulled a stunning upset and won California's 55 electoral votes … he'd still have lost.
- There were only four especially close states in the 2012 election. Only Florida, North Carolina, Ohio, and Virginia were decided by less than 5 percentage points. (Note: Romney won one of them, North Carolina; had he swept those four states … he'd have still lost the election as Obama totaled 272 electoral votes in the rest of the country.) Four is the smallest number of close states in a presidential election since Reagan trounced Walter Mondale nearly 30 years ago.
[Read the U.S. News Debate: Does Barack Obama Have a Mandate?]
So no matter how you slice or dice the election results, this was not a close race. It wasn't a landslide, but it wasn't a coin flip. The voters selected Obama and his vision over Romney and his, and they did it decisively.
And you can layer onto that the fact that, against all expectations, Democrats picked up seats in the U.S. Senate and also in the U.S. House. And while the GOP did retain control of the House, nearly 1.4 million more people voted for Democratic House candidates than for Republicans. 1.4 million—remember that figure the next time someone says Americans voted for divided government last year.
You might also like


|
Vintage 2012 Map of United States presidential election 2012, results by state, November 6, 2012 United States Home (Historic Map)
|
|
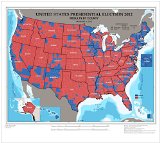
Map Poster - United States presidential election 2012 results by county November 6 2012 / - 24"x21.5" Home (VintPrint)
|


