Presidential Electoral Maps

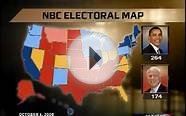
2008 Presidential Election Map
In 2008, Barrack Obama (Democratic Party) ran against John McCain (Republican Party). Obama won the election with 69, 456, 897 of the popular vote (against McCain’s 59, 934, 814). Obama carried twenty eight of the states along with the District of Columbia and one of Nebraska’s electoral votes for a total of 365 electoral votes. McCain carried twenty-two of the states and 173 electoral votes. For a breakdown of popular and electoral votes see the 2008 Official Presidential General Election Results from the Federal Election Commission.
2004 Presidential Election Map
In 2004, George Bush (Republican Party) ran for reelection against John Kerry (Democratic Party). Bush won with 62, 040, 610 of the popular vote and carried 31 states for 286 electoral votes. Kerry won 59, 028, 444 of the popular votes and carried 19 states plus the District of Columbia for 251 electoral votes (one vote in Minnesota was cast for John Edwards). For a breakdown of popular and electoral votes see the 2004 Official Presidential General Election Results from the Federal Election Commission.
2000 Presidential Election Map
In 2000 George Bush (Republican Party) ran against former Vice President (under Clinton) Al Gore (Democratic Party). This presidential election was an extremely tight race and wasn’t decided until well after election day due to a recount of Florida votes. Bush won the election with 50, 456, 002 popular votes and carried 30 states for 271 electoral votes. Gore won more popular votes with 50, 999, 897 but only carried 20 states and the District of Columbia for 261 electoral votes. For a breakdown of popular and electoral votes see the 2000 Official Presidential General Election Results from the Federal Election Commission.
For more in depth cartography from GIS Lounge about the 2000 presidential election: Campaign 2000 – A Cartographic Perspective, and the Recount: the battle for Florida.
You might also like


Popular Q&A

2008 Presidential Electoral College Map? | Yahoo Answers
Looks like you missed NY. By electoral vote the count as you've suggested would be 369 to the Dems, and 169 to the Reps, assuming NY went Dem.
I think it all depends on the candidates:
If Giuliani is the Republican nominee, could he take NY? He'd probably pull the upstate vote, and if he got enough of the city, it may be possible. If he's running against Hillary, what would that do? NY might actually be a swing state...
Or if the Republican governor of MA is the nominee, could he take his own state? Mitt might.
You may have missed some of the smaller states - I'm not sure about VA, …


