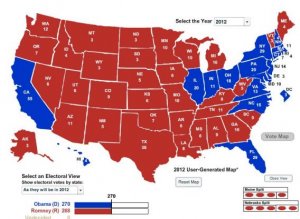
Map of Electoral College
 As a fan of population density, I'm always fascinated by how some electoral maps in the United States "look" big because they include large low-density plots of land. So I got to wondering, what's the geographically smallest possible winning map.
The answer you'll find above. I started with a list of states in order of population density. So you have DC, then New Jersey, then Rhode Island, then Massachusetts, and so forth. Eventually you get a set that wins you the electoral college. Except the bloc of the 18 densest states gives you 282 electoral votes—way more than you need. Eliminate Michigan, the 18th densest, and you have 266 electoral votes. So then you can round things out with little New Hampshire's four electoral votes and you have your winning map.
You might also like


