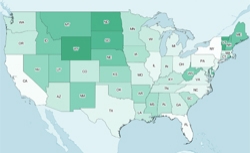
Electoral votes by state map
 There are many reasons to dislike the Electoral College: It gives a handful of states the lion’s share of campaign attention; it allows a candidate with fewer votes to win; it depresses voter turnout in “safe” states; and it’s plain confusing. Now add this one: The electoral power of your vote depends on where you live.
The average electoral vote represents 436, 000 people, but that number rises and falls per state depending on that state’s population over 18 years of age. (The map above shows the population 18 years and older per electoral vote by state.) The states with the fewest people per electoral vote, and therefore the highest “vote power, ” are Wyoming, Vermont, and North Dakota. In Wyoming, there are 143, 000 people for each of its three electoral votes. The states with the weakest votes are New York, Florida, and California. These states each have around 500, 000 people for each electoral vote.
In other words, one Wyoming voter has roughly the same vote power as four New York voters. (Mouse over the map and it will show you where your state ranks in voting power.)
Electoral votes are allocated to the states each decade to reflect population shifts, but every state is guaranteed three electoral votes before allocation kicks in, leaving the least populous states with the most disproportionate number of electoral votes and improving their vote power. That’s why the five states with the most vote power have only three electoral votes.
A state’s vote power also depends on how close the state is to an additional electoral vote. The closer it is, the higher the population per electoral vote. Although the math behind apportionment minimizes this factor, it still results in situations like this: Minnesota has 22, 000 more people than Colorado and one more electoral vote, while Wisconsin has 33, 000 more people than Minnesota and the same number of electoral votes.
“Vote power, ” in the sense used here, doesn’t entirely describe the probability that your individual vote can decisively influence the outcome of the presidential election. To determine that, you also need to know how tight the election is in your state and nationwide. Although a vote in Washington, D.C. is the third most powerful, for example, the probability it will change the outcome of the election is incredibly low.
In the aggregate, though, vote-power disparity does change outcomes, yielding elections, such as the 2000 election, in which the winner is not the one with the highest popular vote. And because the Electoral College mirrors the allocation of representatives in Congress, this map also charts legislative power; 143, 000 people in Wyoming have the same number of legislators in Congress as 500, 000 in New York.
You might also like


